Struggling to hire SLPs? You may be in a speech desert
Some areas are far harder to hire in than others. Find out if you're in a true speech desert.
SLPs are hard to hire. So when a role won’t fill, how do you tell whether it’s you (your hiring strategy), the job (the pay or setting), or simply where you are (your geographic area)?
These things can be genuinely hard to tease apart, but there’s data worth looking at! It’s just not clean or easy, because no organization publishes a definitive ranking of where SLPs are hardest to hire. (We have a funny feeling the mega, VC-backed agencies sit on good internal data of their own— but they’re not the sharing type. We are. So we’ll dig up everything we possibly can, and keep sharing more over time.)
Here’s what’s out there: how many certified SLPs live in each state, how many are employed per capita in each metro, which states have formally declared SLP a shortage field, what survey respondents say about unfilled positions, and what our own Informed Jobs data shows. Each measures something a little different, and none captures time-to-fill or applicant counts directly, but together they’re the hints that help you make sense of your own hiring patterns.
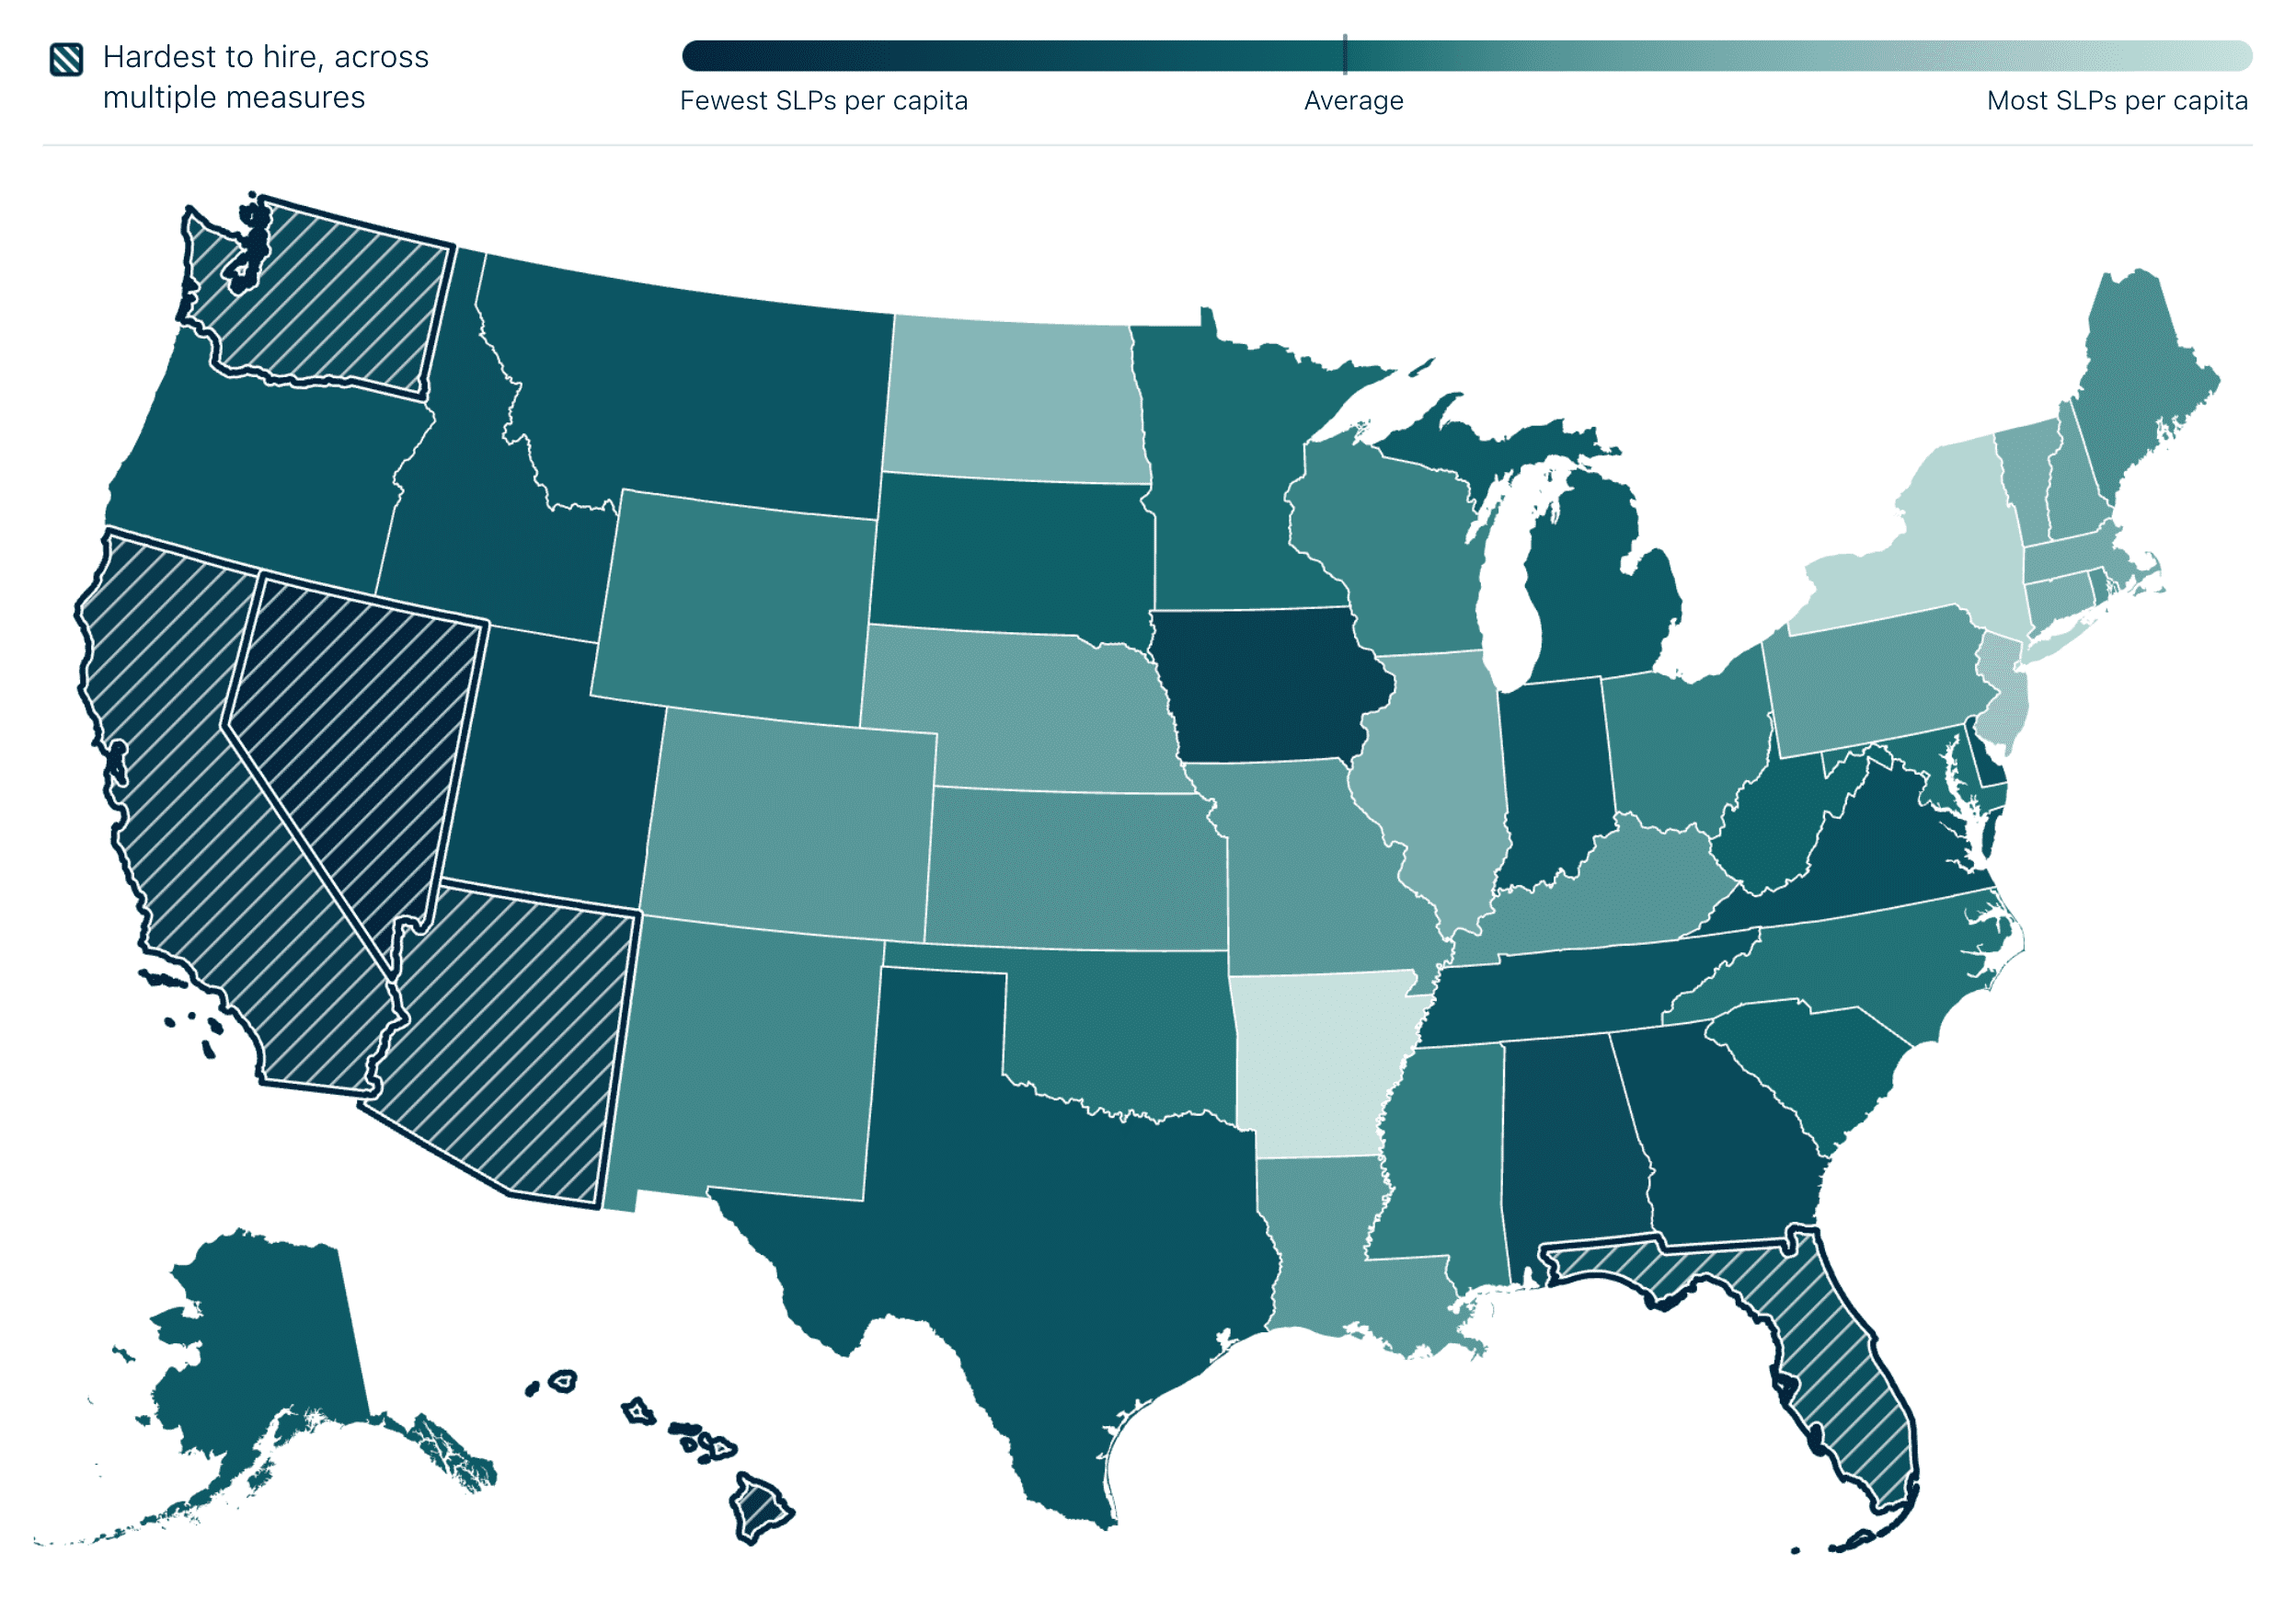
Supply: Which places have the fewest SLPs
Per ASHA’s 2024 ratios report, the West, and Nevada in particular, has the fewest ASHA-certified SLPs per resident:
| State | CCC SLPs | Per 100,000 residents | Rank (1 = most SLPs per resident, 51 = fewest |
|---|---|---|---|
| Nevada | 1,092 | 33.4 | 51 |
| Hawaii | 564 | 39.0 | 50 |
| California | 17,090 | 43.3 | 49 |
| Arizona | 3,419 | 45.1 | 48 |
| Iowa | 1,523 | 47.0 | 47 |
| Washington | 3,992 | 50.2 | 46 |
| Georgia | 5,661 | 50.6 | 45 |
| Utah | 1,783 | 50.9 | 44 |
| Alabama | 2,652 | 51.4 | 43 |
| Virginia | 4,693 | 53.3 | 42 |
| Florida | 12,459 | 53.3 | 41 |
| Texas | 17,274 | 55.2 | 38 |
| Arkansas (highest) | 3,118 | 101.0 | 1 |
| New York | 19,004 | 95.7 | 2 |
| New Jersey | 8,385 | 88.3 | 3 |
Does what Informed Jobs is seeing in fill rates match this data?
Yes. While our time-to-fill dataset isn't large enough to separate out by state (because unfortunately only a tiny fraction of employers report to us the exact day they hire someone and where they came from; that's ok, we get it, you're busy! ) we have hand-helped several employers whose jobs we thought were just excellent, and they were doing all the right things, and even with us helping they STILL couldn’t fill their jobs within 3–6 months. Yes, this was a crush to our ego, but those places were: Washington, California, and Hawaii. So at least it matches this data? (Sigh)
Note also when you look at ASHA’s data a few other things:
- The gap is wide. Based on number of available SLPs alone, a New York employer has over double the chances of hiring compared to a California employer. Or put another way, they’re drawing from a candidate pool that is twice as large. When jobs are hard to fill, that’s a huge difference, and often the difference between a couple viable candidates vs zero.
- Local supply is growing too slowly to keep pace with demand—basically everywhere. While every state is gaining SLPs over time—not losing them—the need is rising faster than supply, due to things like aging population, more diagnoses, early-intervention mandates, etc.
- The CCC-SLP count grew 3.3% in 2024; but BLS projects 15% employment growth for 2024–34, versus 3% for all occupations.
- This means hard to hire places are getting only getting harder.
Employment: Where SLP jobs are scarce relative to the workforce
The May 2023 OEWS profile for occupation 29-1127 counts 172,100 employed SLPs nationally (remember—ignore the wages in the BLS data, which are wrong; the SLP counts should be right though).
The BLS puts many of the same states that ASHA data shows are undersupplied with SLPs at the bottom, too. The location quotient (LQ) compares an area's share of SLP jobs to the national share; 1.00 is average, so the lower the number the harder to hire:
| Area | Employed SLPs | Location quotient |
|---|---|---|
| California | 17,270 | 0.85 |
| Florida | 7,850 | 0.72 |
| District of Columbia | 420 | 0.53 |
| Hawaii | 130 | 0.19 |
| Los Angeles-Long Beach-Anaheim | 4,750 | 0.68 |
| Washington-Arlington-Alexandria | 2,370 | 0.68 |
| San Jose-Sunnyvale-Santa Clara | 850 | 0.66 |
| San Francisco-Oakland-Hayward | 2,520 | 0.92 |
| Phoenix-Mesa-Scottsdale | 2,500 | 0.96 |
| New York (highest state LQ) | 16,610 | 1.56 |
| Arkansas | 2,230 | 1.55 |
Don’t see your location? Find it here.
As you examine these, you’ll find that BLS and ASHA agree on the broad map: California, Hawaii, Arizona, and Florida are low on both. There are some places where the data disagrees, but could be due to how SLPs are counted.
Official shortage designations: What states say about themselves
States tell the U.S. Department of Education each year which fields they cannot staff, and SLP appears on many of those lists. The full record lives in the Teacher Shortage Areas interactive application at tsa.ed.gov, with coverage through 2025. A couple examples from this report:
- Connecticut lists SLPs as a statewide PreK–12 shortage for 2025, and has nearly every year since at least 2014;
- Nebraska lists the same, and has proposed SLPs for 2026–27 loan-forgiveness purposes (also here).
The Learning Policy Institute's 2026 teacher shortage factsheet also provides a view of this data: 29 states plus DC published vacancy counts totalling 37,569 unfilled positions, and 45 states reported special education as a shortage area. While the report doesn’t call out SLPs specifically, we’re usually folded into special education or related services in those counts.
Demand: What employers and clinicians report
ASHA's 2025 Supply and Demand Resource List summarizes its two practitioner surveys:
- Schools (2024 Survey): 78.5% of respondents said job openings exceeded job seekers in their setting and area. Respondents in the Mountain and Pacific states were the most likely to say so. This is the same region that ranks lowest on both the ASHA and BLS supply measures.
- Healthcare (2025 Survey): 55.5% said openings exceeded seekers, 24.2% said the market was balanced, and 20.4% said seekers outnumbered openings. Respondents in New England and the South Atlantic states were the most likely to report excess openings. 44.8% reported funded, unfilled SLP positions at their facility, with pediatric hospitals the most affected.
Here’s where things get a bit confusing, though:
- The school shortage is a “not enough bodies” problem. It’s worst exactly where there are the fewest SLPs per capita. So the cause and the symptom line up: few SLPs around, hard to staff schools.
- However, the healthcare shortage shows up in regions that actually have lots of SLPs per capita. So you can’t claim a speech desert—the people are right there. Instead, they’re just not taking the healthcare roles, so something other than headcount must be driving that.
- What’s the deal here? The data shows that SLPs are steadily migrating toward healthcare. Since 2010, the share working mainly in schools has declined steadily, from 54.0% to 49.7%, while the share in non-residential health care (outpatient clinics, private practices, etc.) rose from 15.5% to 20.8%.
- However, “healthcare” isn’t just one setting. SLPs leaving schools are flowing into the better healthcare jobs—those with better pay and better working conditions. So with a broad overarching shortage of SLPs, the healthcare settings that "can't hire despite lots of SLPs nearby" are the unattractive ones, where SLPs would simply rather be somewhere else.
In sum, in the schools, it’s more likely that the SLPs just aren’t there; while in healthcare, it’s more likely that employers are losing SLPs who are interested in better offers. However regardless of setting, there’s unlikely to EVER be one explanation, and all the reasons that cause an SLP to be available for your job, apply to your job, and keep your job must all be assumed to be at play.
So how do we make sense of all this?
Six states show up as hard markets on every measure we could find: Nevada, Arizona, California, Hawaii, Florida, and Washington. So if you’re hiring in one of those states—we’re so sorry this is so much harder than it should be. Please don’t compare yourself directly to others, and we’ll help all we can!
However, it’s not just those states that struggle. Also keep in mind:
- SLP hiring is hard even in states with lots of SLPs. For example, Connecticut, 5th in density, designates school-based SLPs as a statewide shortage every year. So they’re at the top of the pack of “opportunity” but still struggling.
- It’s not just about state, but setting too. All settings are competing with each other for different reasons. The fact that SLPs can bop around between schools, hospitals, SNFs, private practice, home health, early intervention, and more means all employers have to look not only at local competition, but setting competition as well. (And then there’s remote work, which is likely your biggest competitor).
- Rural and small-city markets can be tight despite high state averages. Analyses (like this article!) that collapse across the states hide differences among cities and rural areas.
In sum: All employers should expect difficulty hiring SLPs, basically everywhere. But even the “big dogs” (e.g. highly-resourced large staffing agencies) will have difficulty in the hardest states to hire.
And what do we do next?
We’ll give you every possible tip and trick we know. Promise. We publish and update guidance regularly on our “Hiring Advice for Employers” page, so check back regularly.
And for those who have jobs posted on our SLP job board, we’re happy to provide individual guidance!